Landscape Design Intelligence
Move your mouse, or drag the handle on mobile, to reveal
The shift
Look at any new launch.
What is on the billboard?
Since 2020, outdoor space moved from nice-to-have to deciding factor. In Dubai, developers now lead with amenities: the pool, the park and the podium garden come first. The apartment comes second. Landscape is usually budgeted as a percentage and trimmed late; we bring it in before concept stage instead, so it earns rather than gets cut.
66%
1.5%
16–22×
The problem
Interiors get the budget. Outdoors get leftovers
A bench in full sun is just an expensive sculpture.
8 min
Average daily time outdoors in comparable developments
Thermally hostile
At 28°C people leave after about 8 minutes.
Visually flat
A uniform podium gives nobody a reason to linger.
Commercially silent
No dwell time means no terrace spend and no premium.
Source: FFS behavioural study, Rise by Athlon, Dubai, against comparable developments without comfort led design.
Fluidscape
Four layers. One site. One answer
Environment
Climate, shade and comfort, read from NASA and Google data and modelled to the site.
Behaviour
How people really use a space: dwell, activity and return visits.
Economics
What the landscape costs to build and what it earns back.
Time
How the planting grows, blooms and ages, month by month, matched to local nursery stock.
The logic
Design inputs in. Measurable money out
Landscape stops being a line item and becomes a lever.
Design input
Shade, seating, planting, water
Things a designer controls on day one.
Behaviour
Dwell time, activity, return visits
What people actually do with the space.
Outcome
Spend, premium, retention
What the developer and the operator are paid for.
Calibrated across our projects, measured on every new one
Environment · NASA data
Before we design, we read the planet
| 2024 | London | Dubai | Singapore |
|---|---|---|---|
| Mean air temperature | 11.2°C | 28.9°C | 27.8°C |
| Peak month, daytime high | 23.8°C Jul | 41.9°C Aug | 32.4°C Apr |
| Peak month, 24 h mean | 18.2°C Aug | 36.0°C Jul | 29.0°C Apr |
| Relative humidity | 86% | 61% | 86% |
| Wind at 10 m | 5.0 m/s | 3.7 m/s | 2.9 m/s |
| Solar, annual mean | 2.88 | 5.37 | 4.50 |
| Solar, seasonal range | 0.58–5.84 | 3.64–6.99 | 3.87–5.42 |
16.6°C
Mean temperature gap, London to Singapore, at the same 86% humidity
Same air moisture. Completely different comfort problem.
One method. Three different problems
London
Capture sun. Block wind.
Solar swings tenfold, from 0.58 in December to 5.84 in June. Wind averages 5.0 m/s at 10 m.
Lever: Winter sun and shelter
Dubai
Shade and plant.
Daytime highs average about 42°C in July and August. Vegetated land is about 3.5°C cooler than desert.
Lever: Shade and planting
Singapore
Move air. Cool the night.
Temperature barely moves: 26.6–29.0°C all year. Humidity is 86%, wind only 2.9 m/s.
Lever: Airflow and night comfort
Source: NASA POWER monthly API (MERRA-2 reanalysis), 2024 values, Canary Wharf, Dubai Marina, Marina Bay. Solar in kWh/m² per day. Grid cell values set the regional boundary conditions for UTCI, not site microclimate. Also NOAA 1991–2020 normals, Dubai Airport; Gulf cities Landsat study, Annals of GIS, 2025.
The data stack
Open data explains the place. Ours explains the people
Open layers explain why a place is hot or cold. Ours explain who uses it and what it is worth. All of it is served through Google Earth Engine.
Open layers · NASA and Google
- ClimateNASA POWER, MERRA-2
- Surface heatNASA Landsat, ECOSTRESS
- GreeneryNASA MODIS NDVI, Landsat
- Night activityNASA Black Marble
- Land, buildingsGoogle Dynamic World, Open Buildings
- FootfallOpen pedestrian and city sensor counts
Fluidscape layers · built by us
- Our sitesObserved behaviour on built projects
- CoefficientsDesign to outcome links
- Partner dataProperty value and uplift
- Live pricingSupplier and nursery feeds
Ten layers, one site model
Resolution decides everything
Approximate pixel size, log scale
- NASA POWER~50 km
- MODIS NDVI250 m
- ECOSTRESS heat70 m
- Landsat30 m
- Dynamic World10 m
- Our site modelmetres, on the plot
A climate grid is 5,000 times coarser than a land cover pixel.
Satellites are brilliant at weather and terrible at headcount. They explain why a place is hot or cold. They cannot count the people sitting in it. So we fuse every layer down to the plot and check it against our own UTCI modelling.
Proof
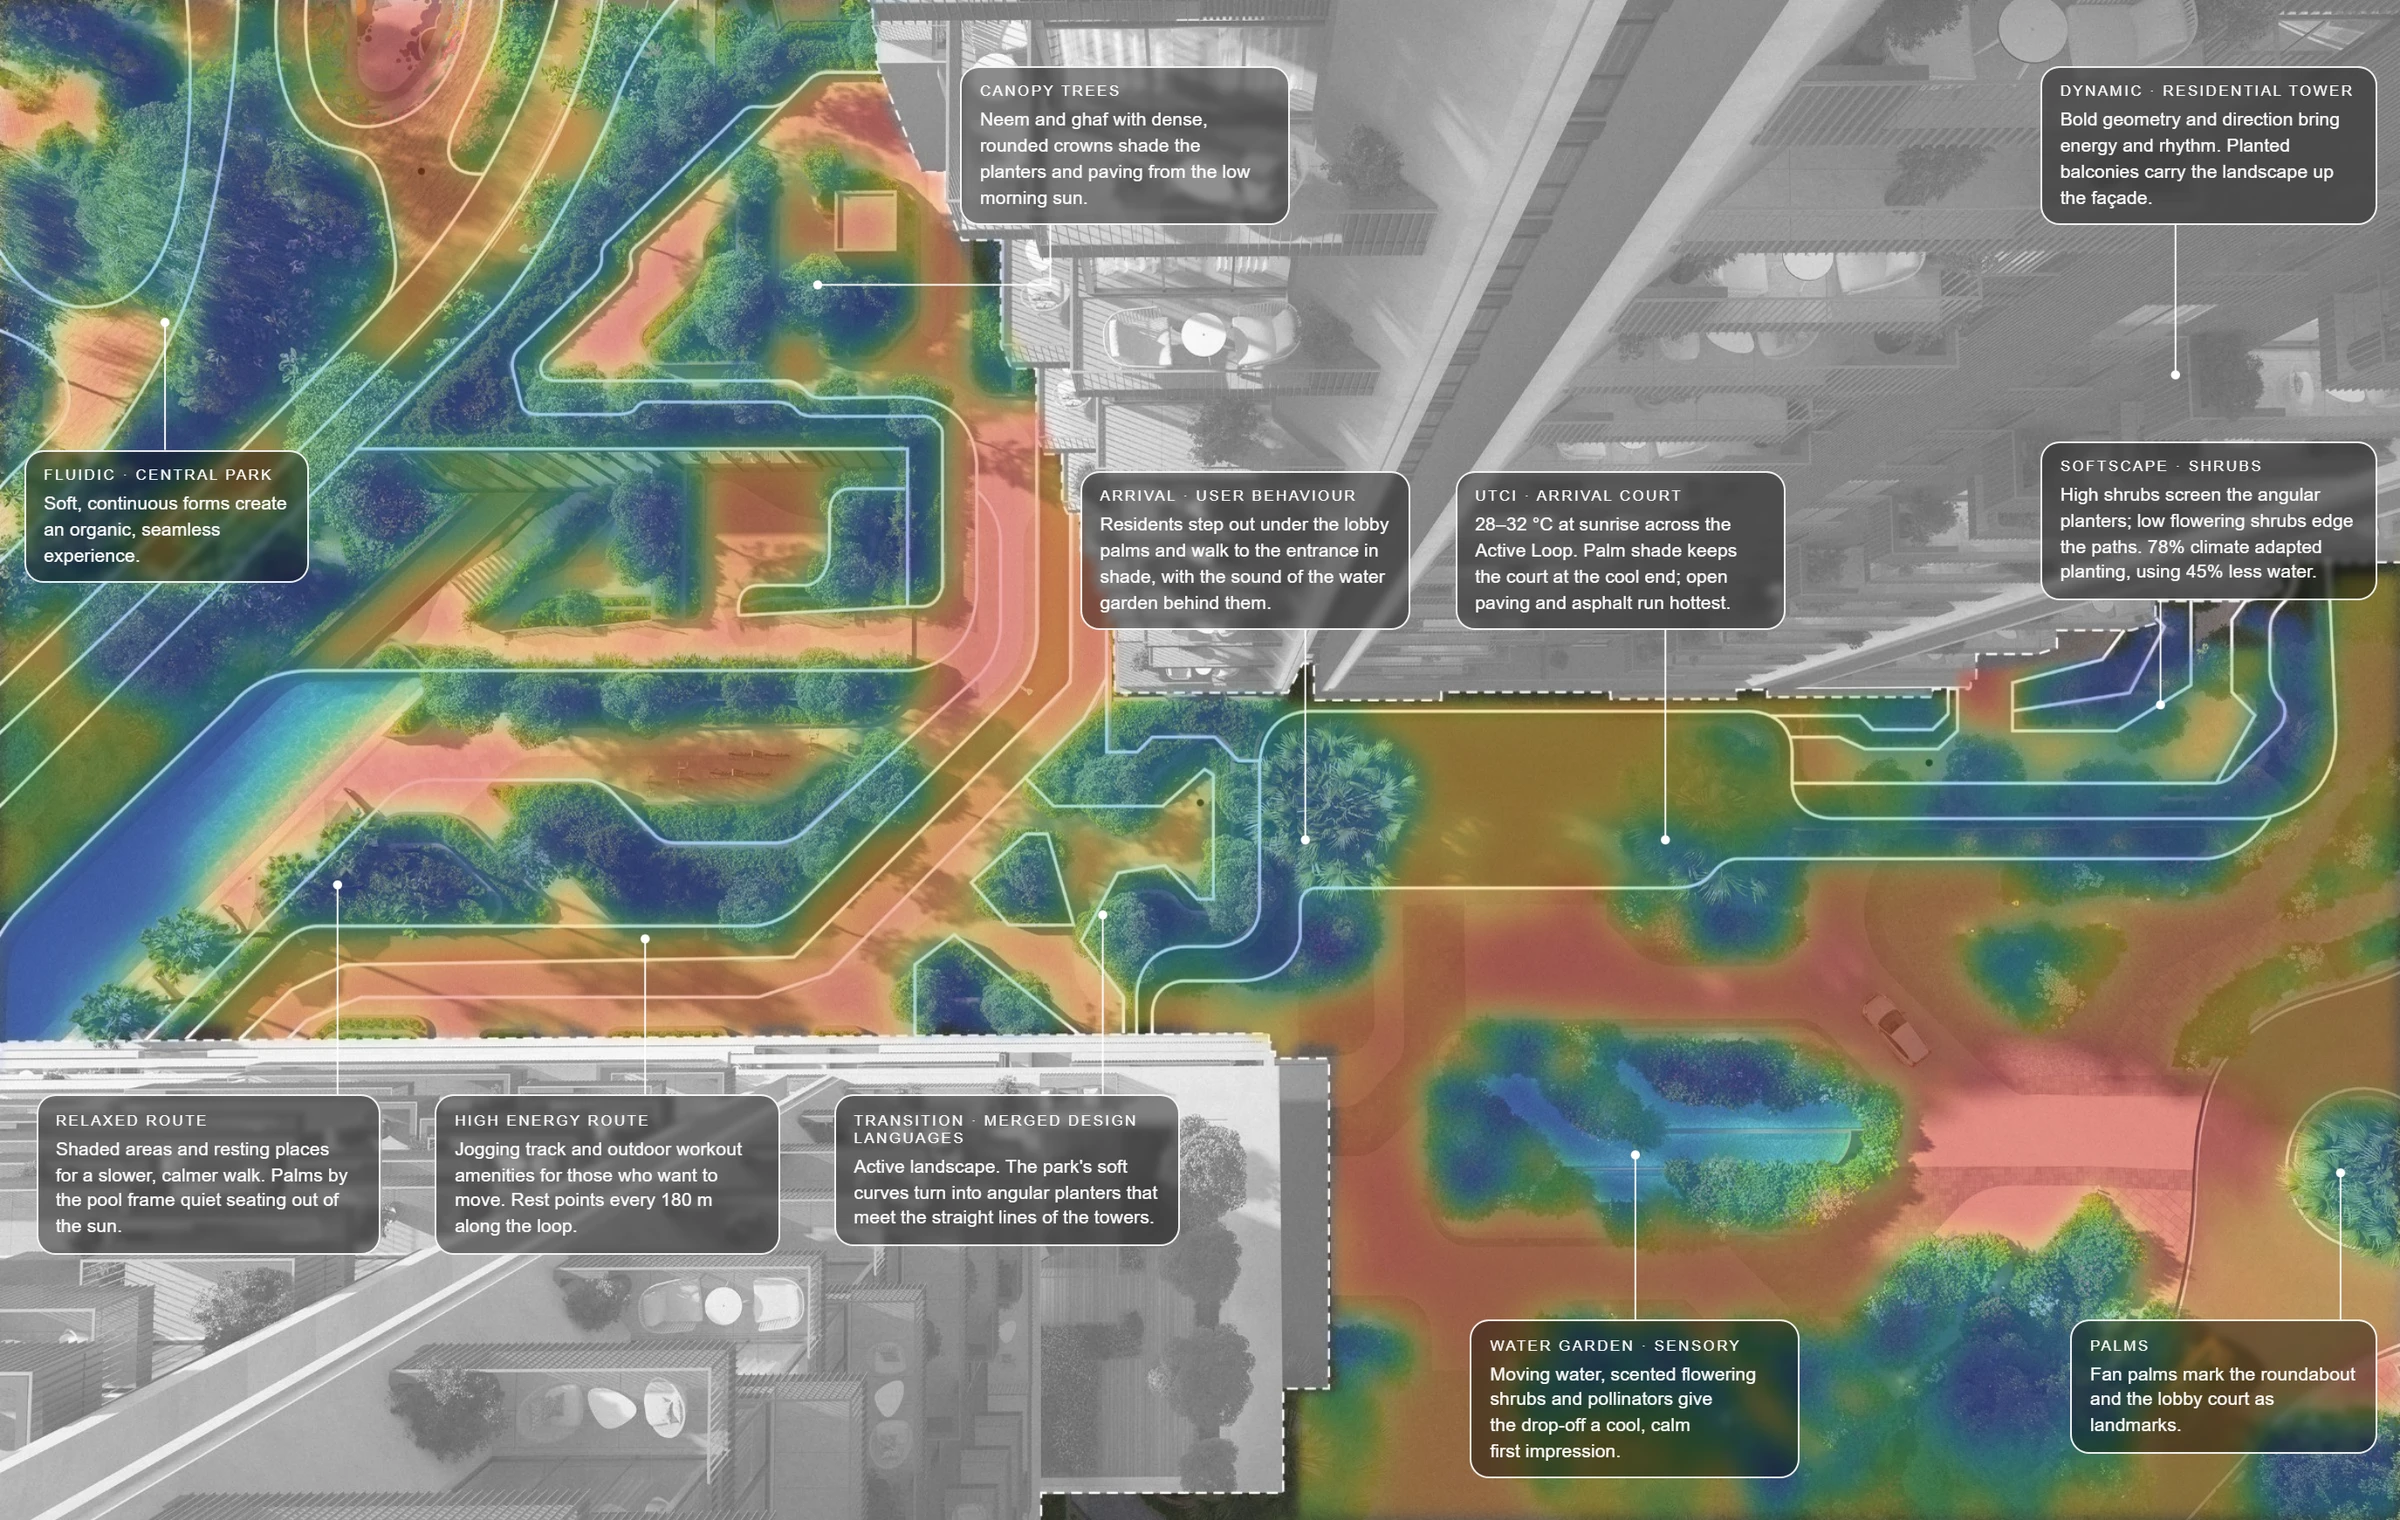
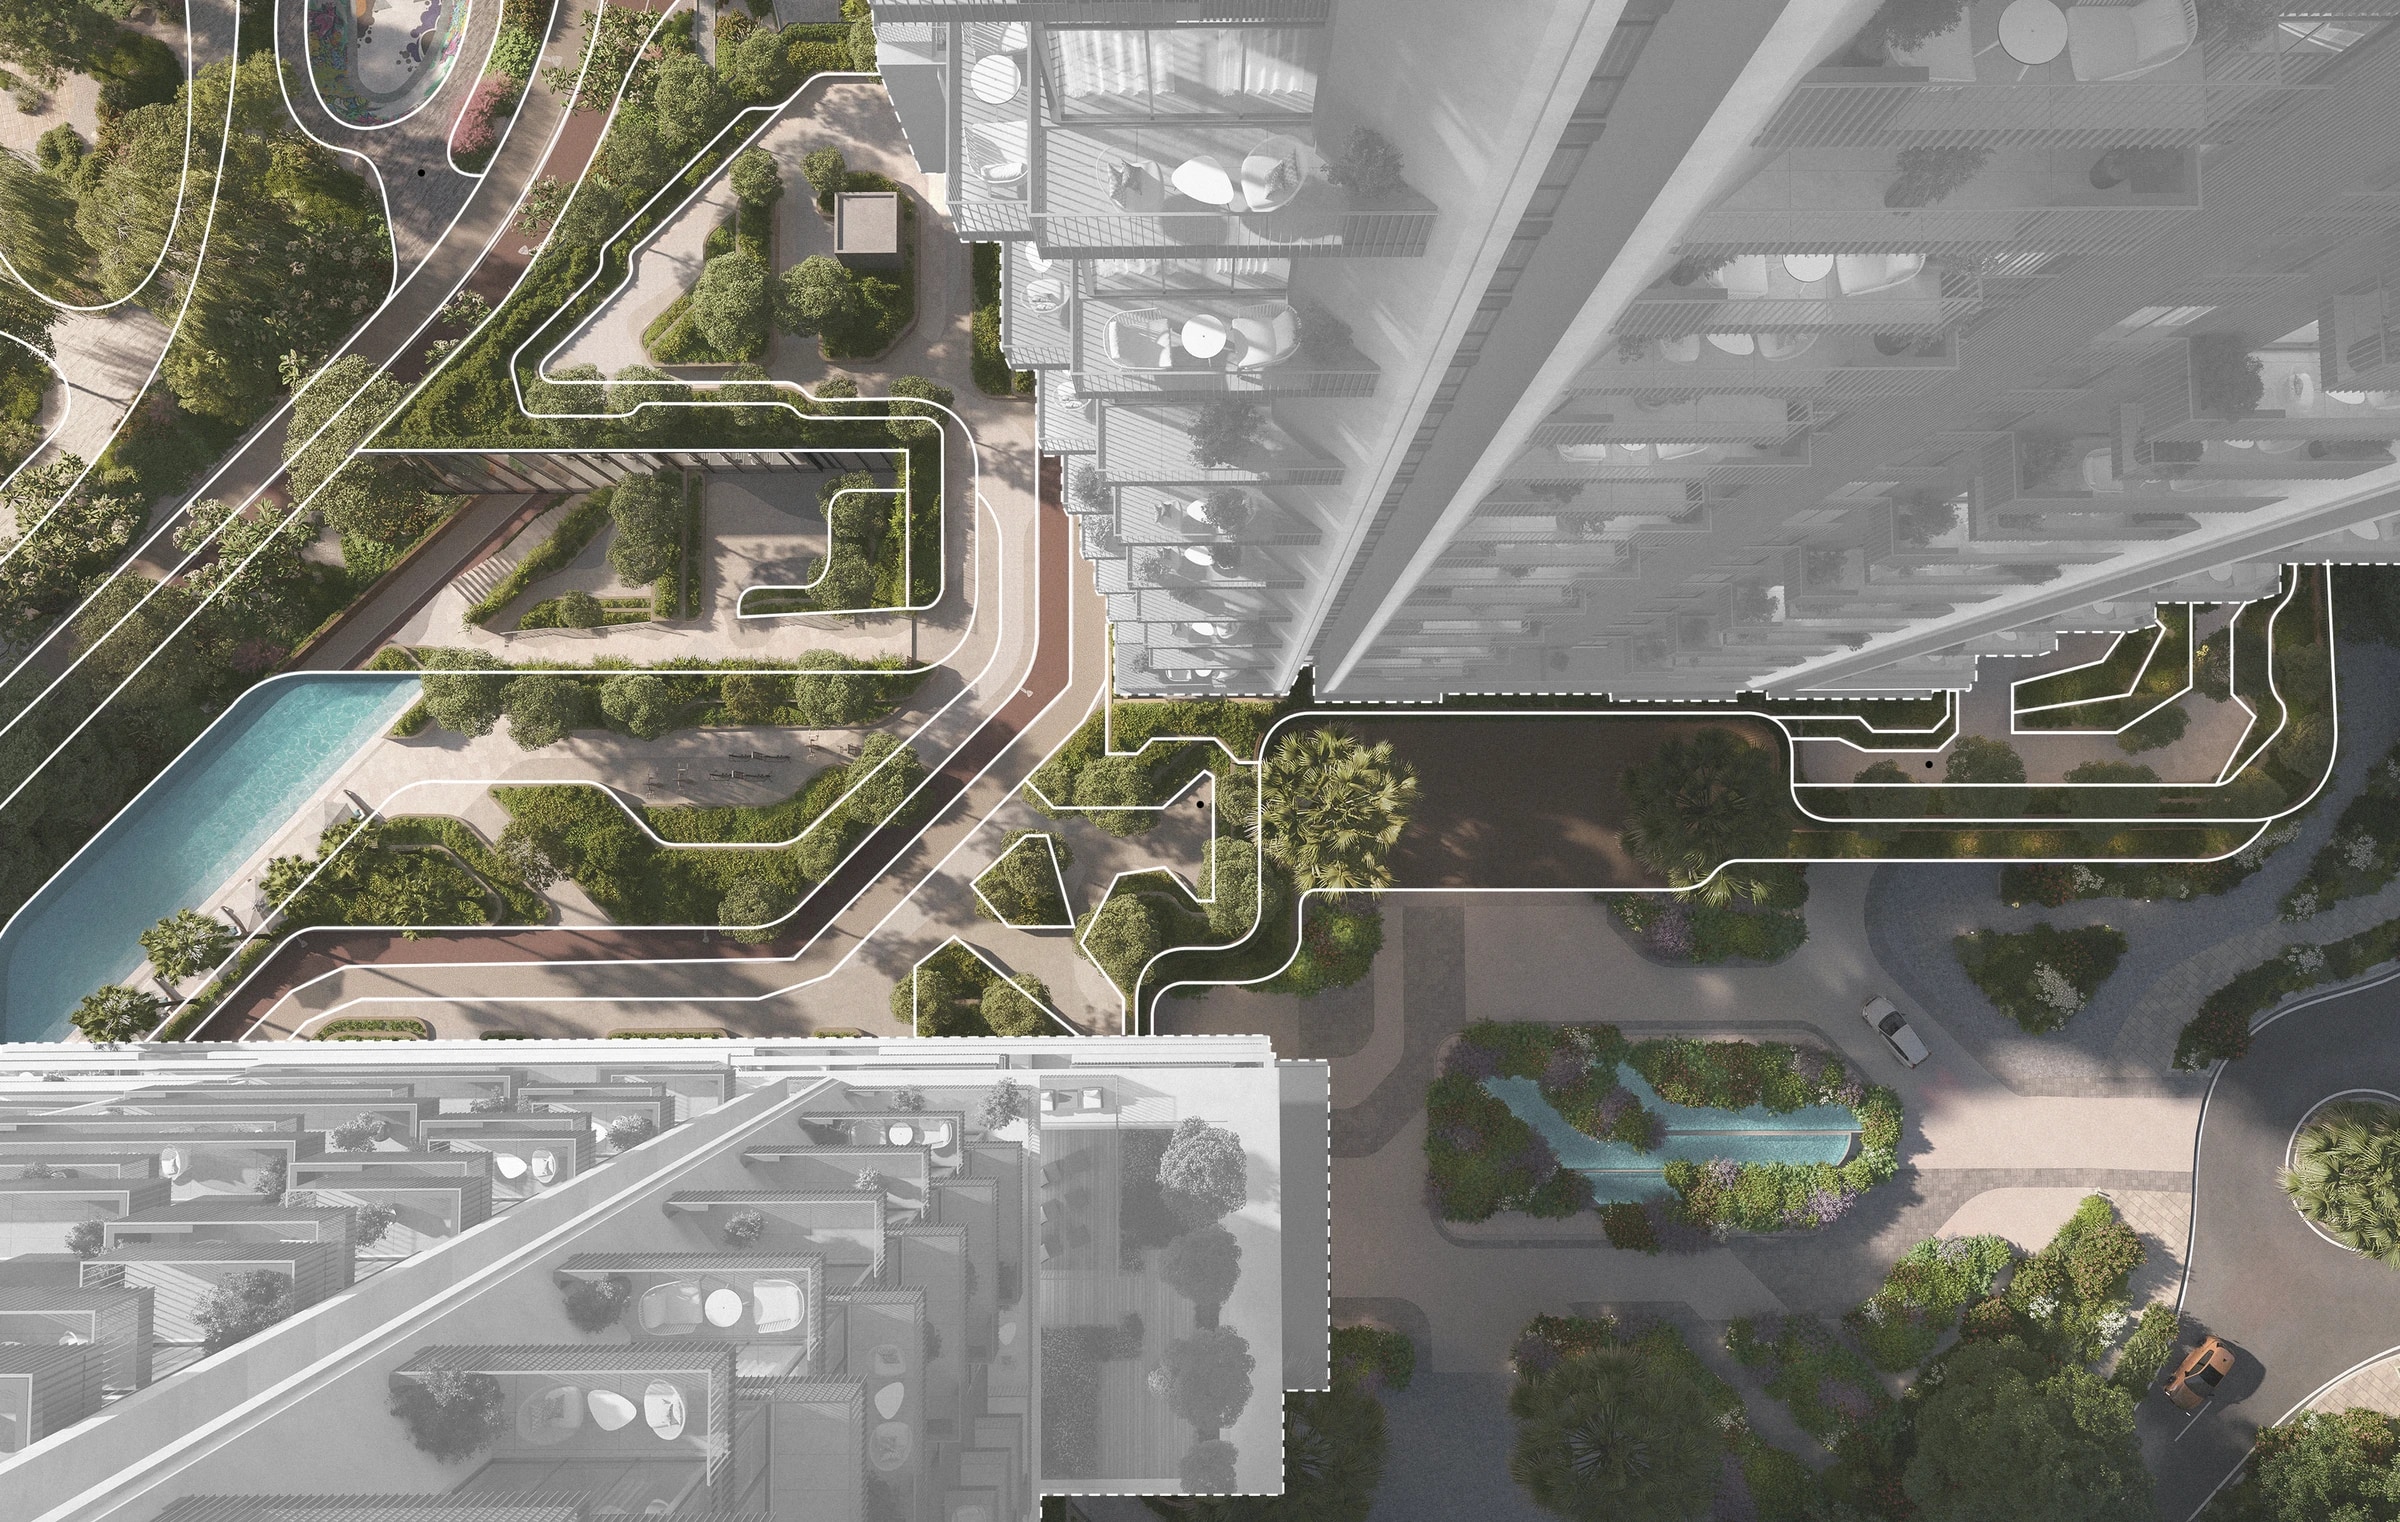
Rise by Athlon, Dubai
Landscape designed as two systems for two behaviours, then measured before and after occupancy.
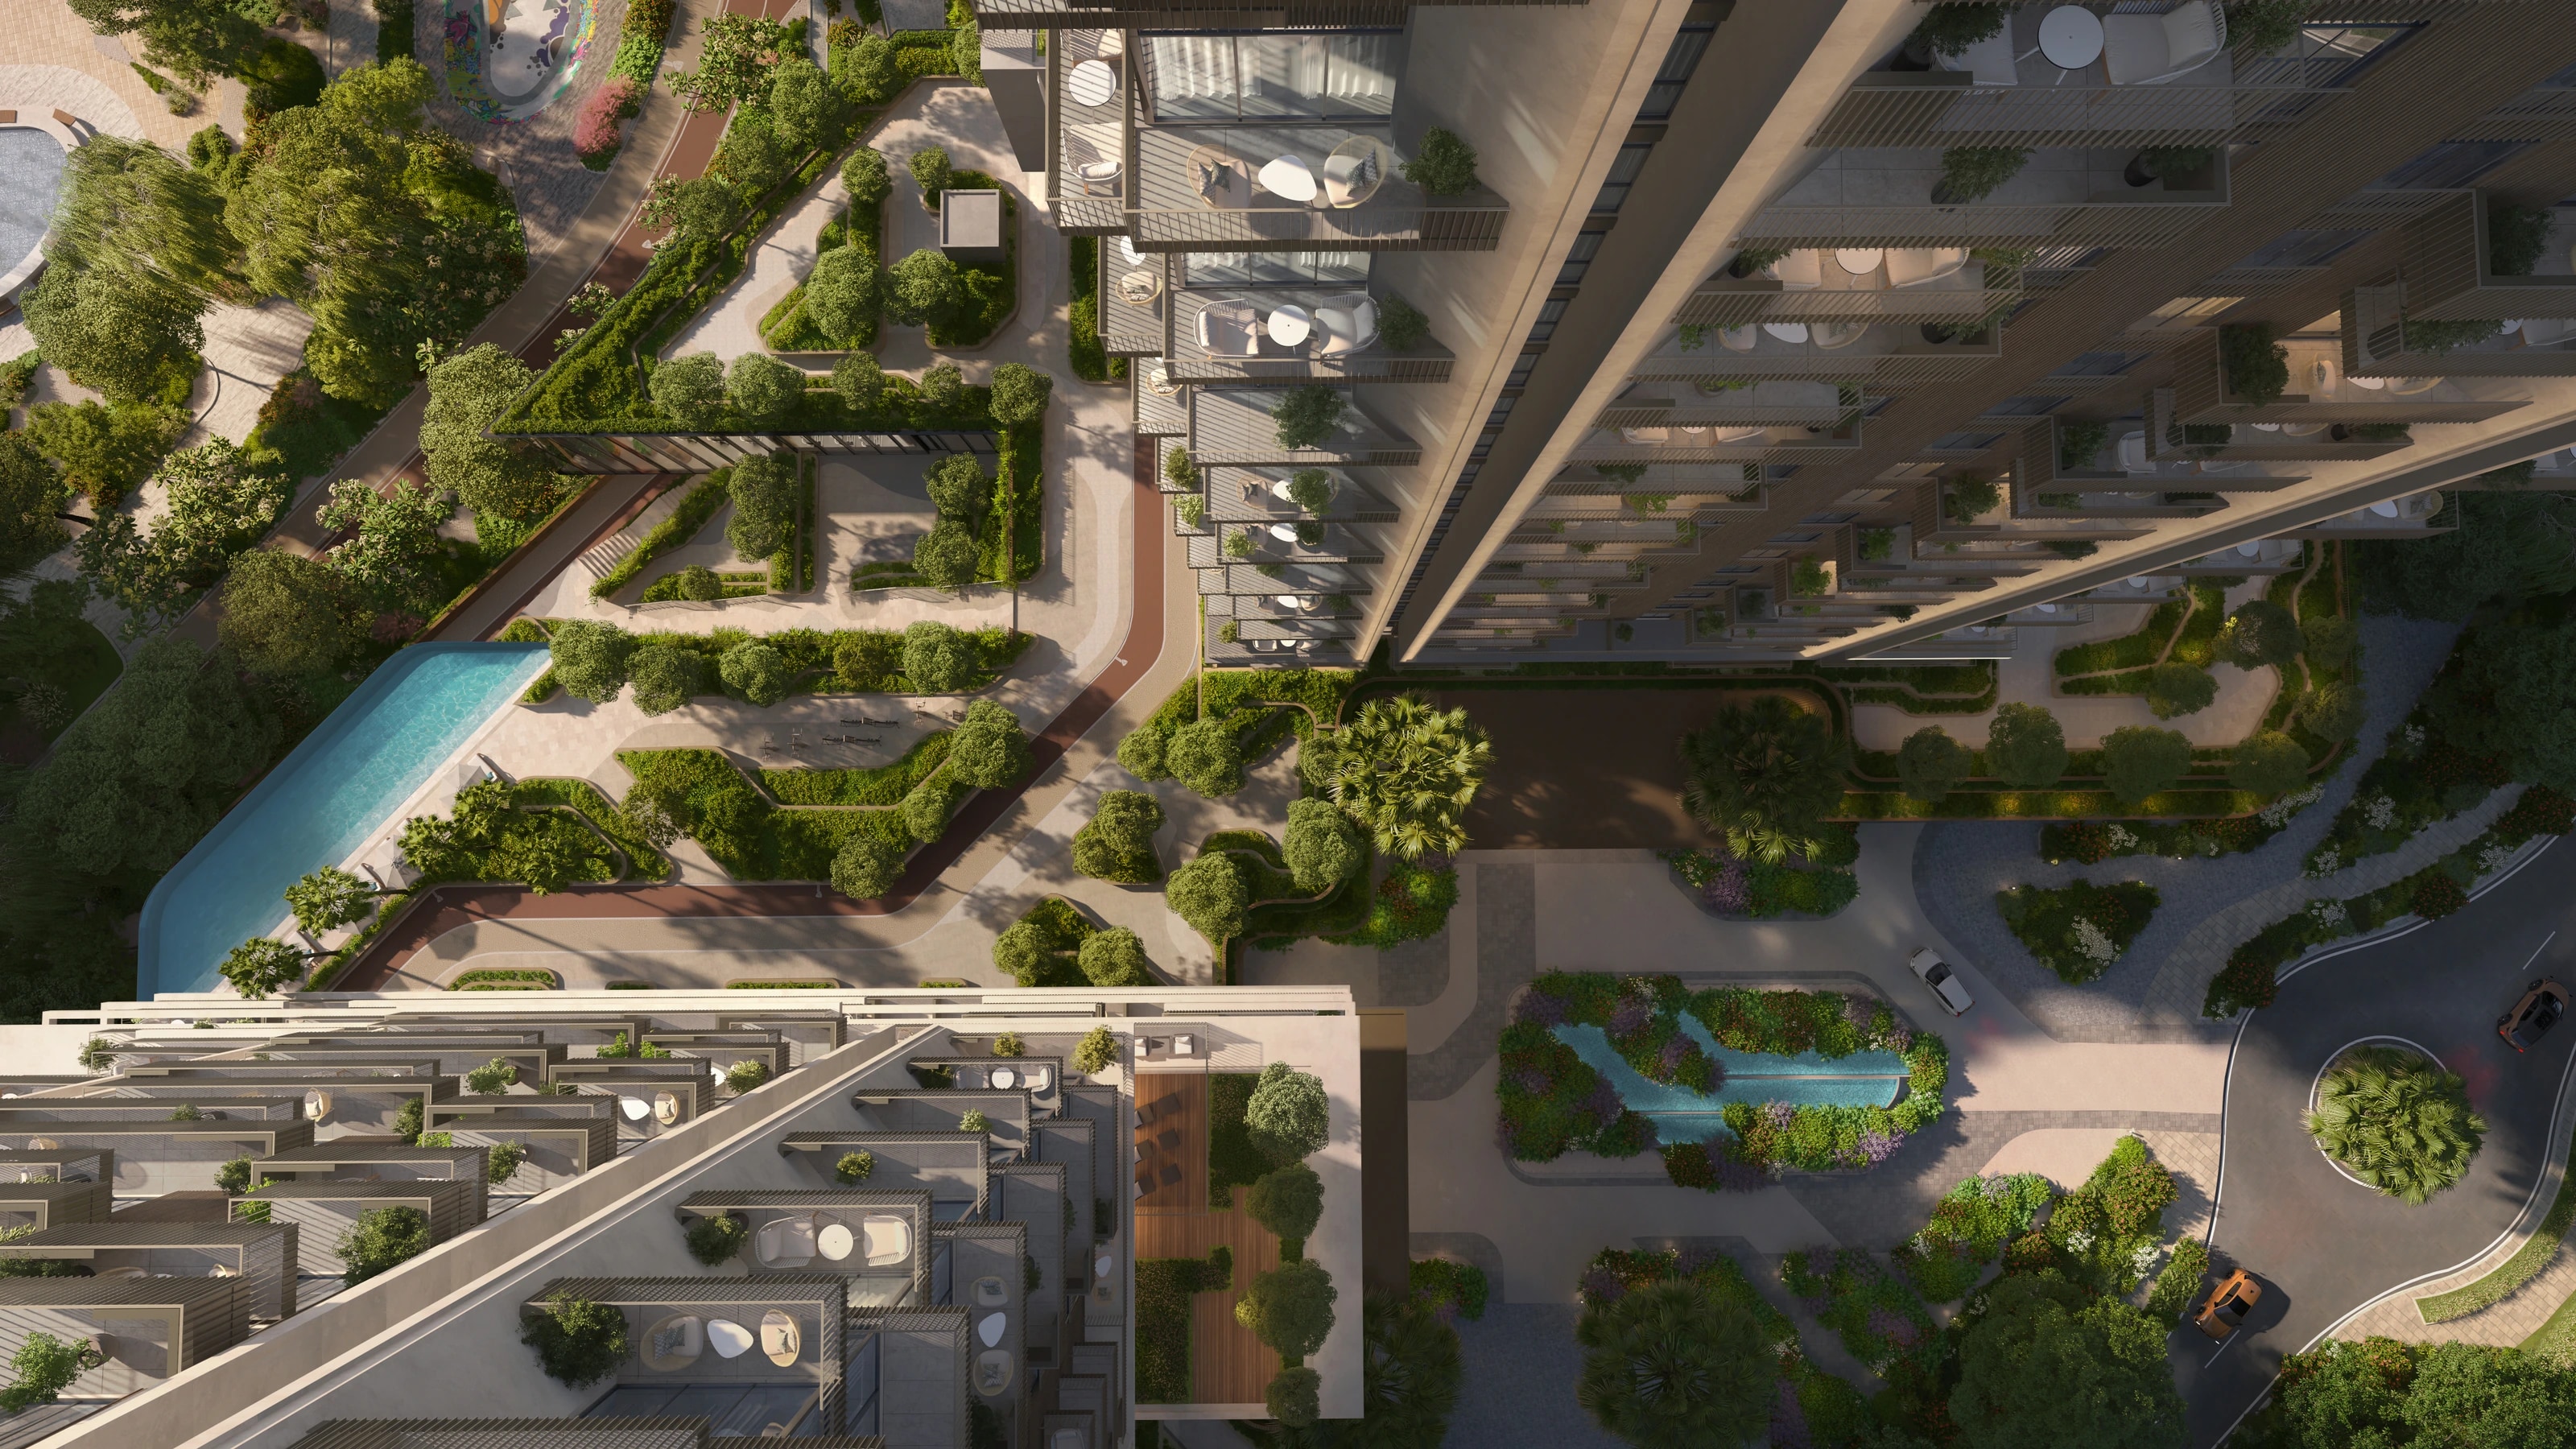
- Homes
- 1,243 apartments
- Active loop
- 4.6 km, morning
- Recovery loop
- 3.7 km, evening
- Evening comfort target
- UTCI 22–26°C
Measured before and after occupancy
People vote with their feet. We count
2.25×
More time outdoors
Four degrees decides it. At 28°C people leave after about 8 minutes. At 24°C they stay for 18 or more.
Year one retention by outdoor use
A 23 point retention gap between heavy users and non users.
Source: FFS behavioural study, before and after occupancy, Rise by Athlon, Dubai. Baseline: comparable developments.
Economics
Every dwell minute has a price
Cost model
What it costs to build
Cost per square foot from live nursery and supplier pricing, plus labour.
Value model
What it earns back
Retail spend, unit premium, retention and eligibility for sustainable finance.
45%
Less irrigation water: 1.2M to 660k m³ a year against a conventional baseline. Rise by Athlon.
7–19%
Property value associated with mature trees. US Forest Service research review.
0.3°C
Cooler air for every 10% of canopy cover. WRI, drawing on a Nature Communications meta analysis.
The return
What is the price per square foot of a landscape project?
The spend is the same either way. What that spend returns is not: the same budget, modelled through our process, compounds into a different outcome by handover.
Time · The fourth layer
A garden that improves with age
We forecast bloom, colour and upkeep from month 1 to month 36, so the garden looks its best with minimal maintenance.
Bloom calendar · who flowers when
Month 1 of 36 · Year 1
Structure first
Form and seedheads chosen so the garden reads well in winter too.
Right plant, right place
Species matched to soil, light and moisture, so they thrive unaided.
Layered communities
Dense mixed planting that closes over bare ground.
Illustrative bloom windows for a UK bed, from the Fluidscape plant model. Interest score, ground cover and upkeep hours are tracked every month from month 1 to month 36.
Supply · Time meets the nursery
From planting plan to purchase order
Plant palette
Chosen for the site and the calendar. Bloom, structure and ageing, month by month.
Nursery match
Matched to local inventory. Every species checked against what nurseries near the site actually grow.
Live price
Priced from the supplier list, by size, quantity and availability, not a rule of thumb.
Cost per sqft
Updates as the design moves. Swap a drift and the cost band follows.
Out of stock? The forecast still holds
When a species is unavailable, Fluidscape proposes a substitute with the same bloom window, height and colour, so the month by month picture does not break.
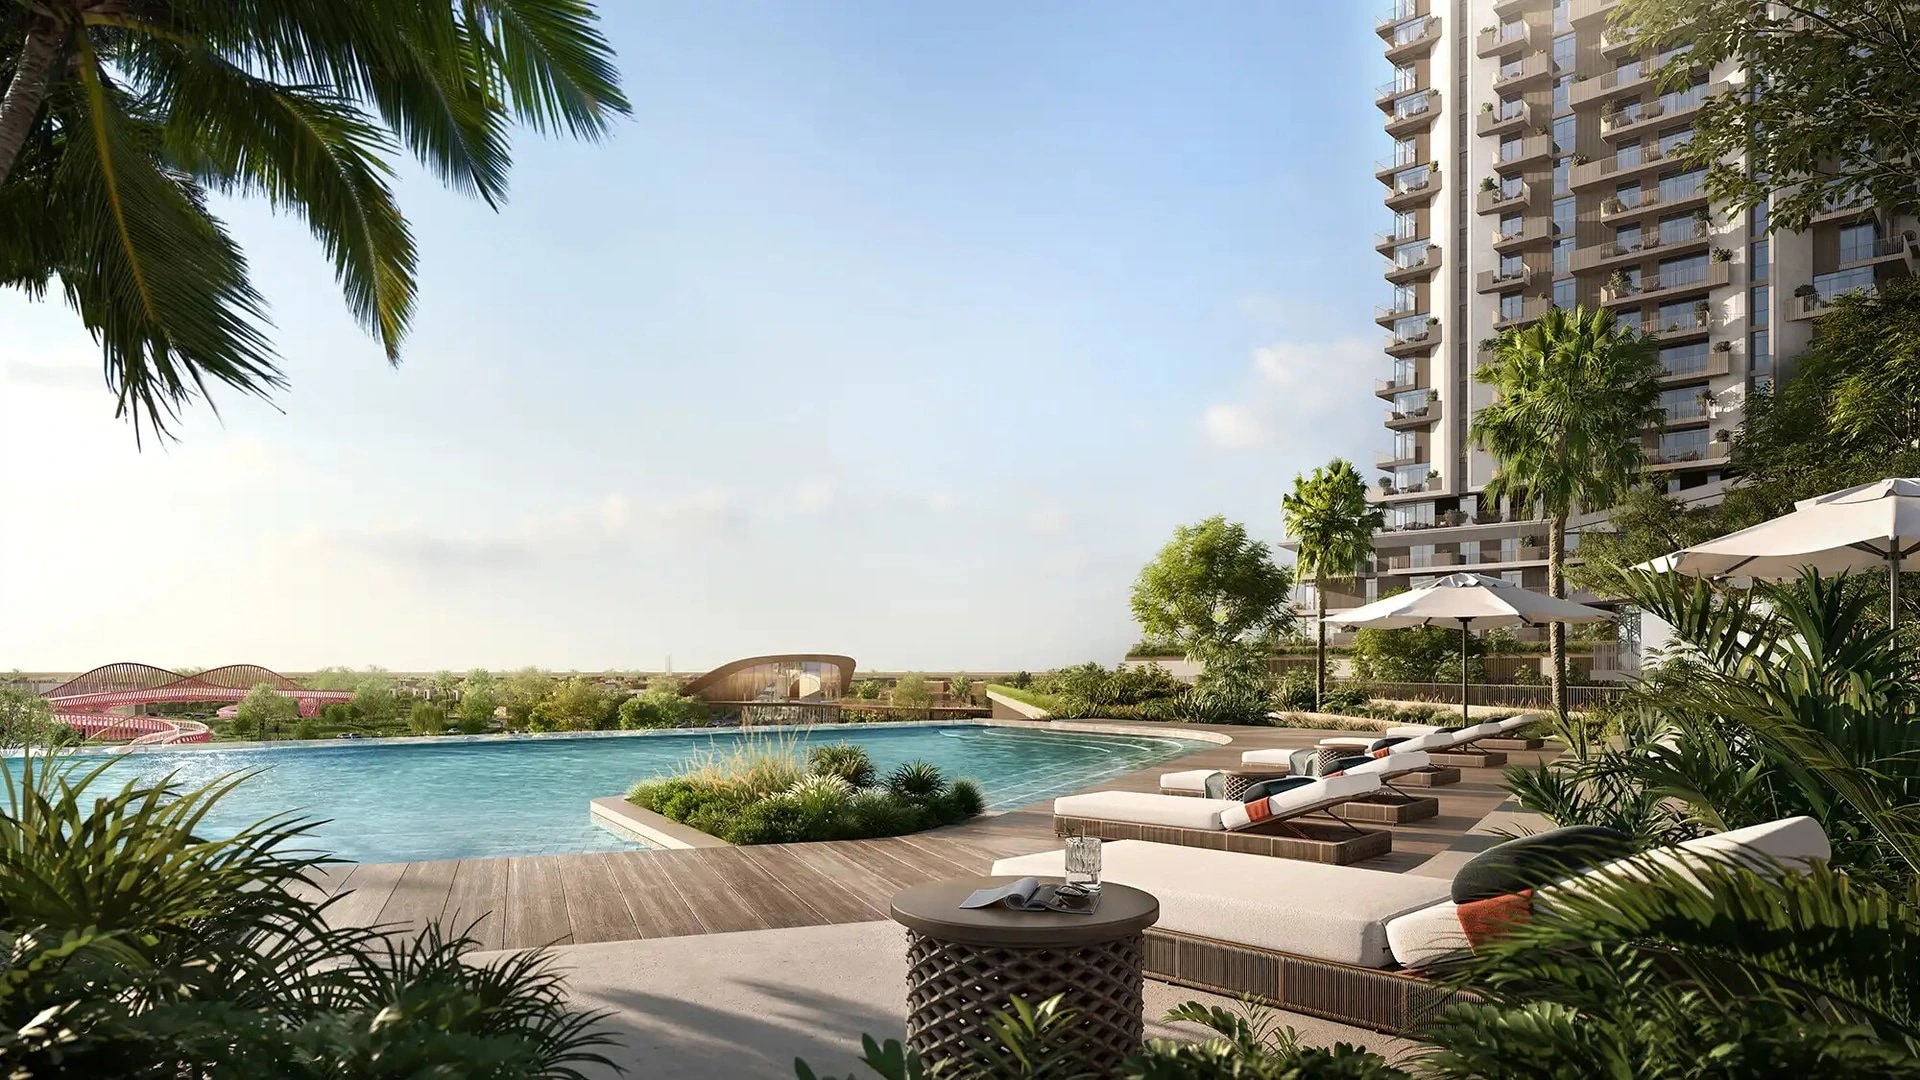
Cost-Driven Design
The same design. A managed cost curve
Every landscape can be delivered across a range of investment levels without changing the idea behind it. Planting maturity, paving grade and furniture specification move stage by stage, so a project's budget is met without cutting the design that gives it value. Select a specification to jump to its full walkthrough below.
Packages
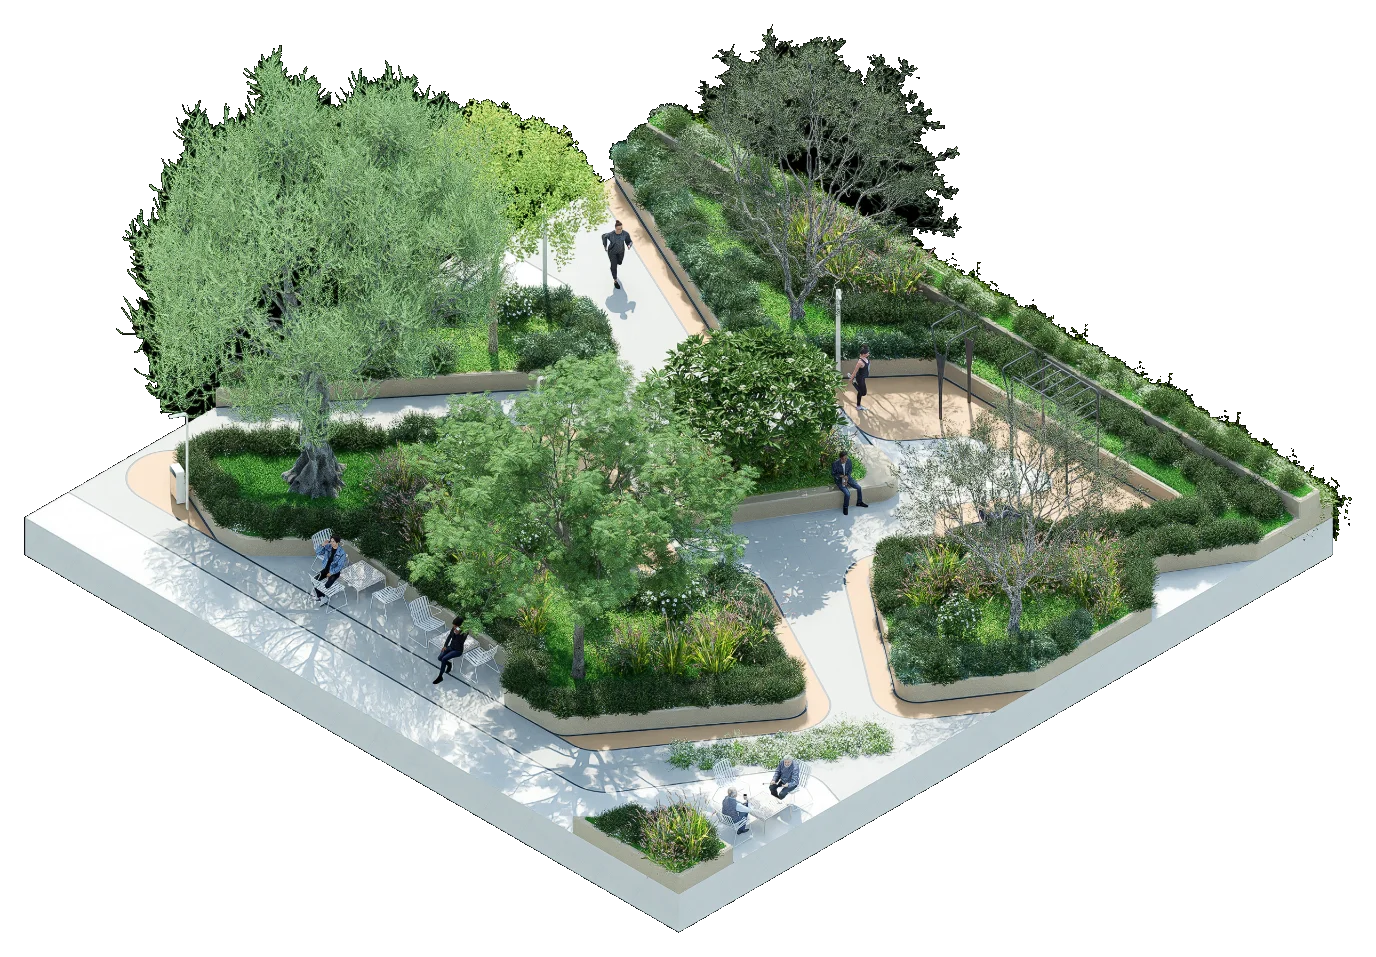
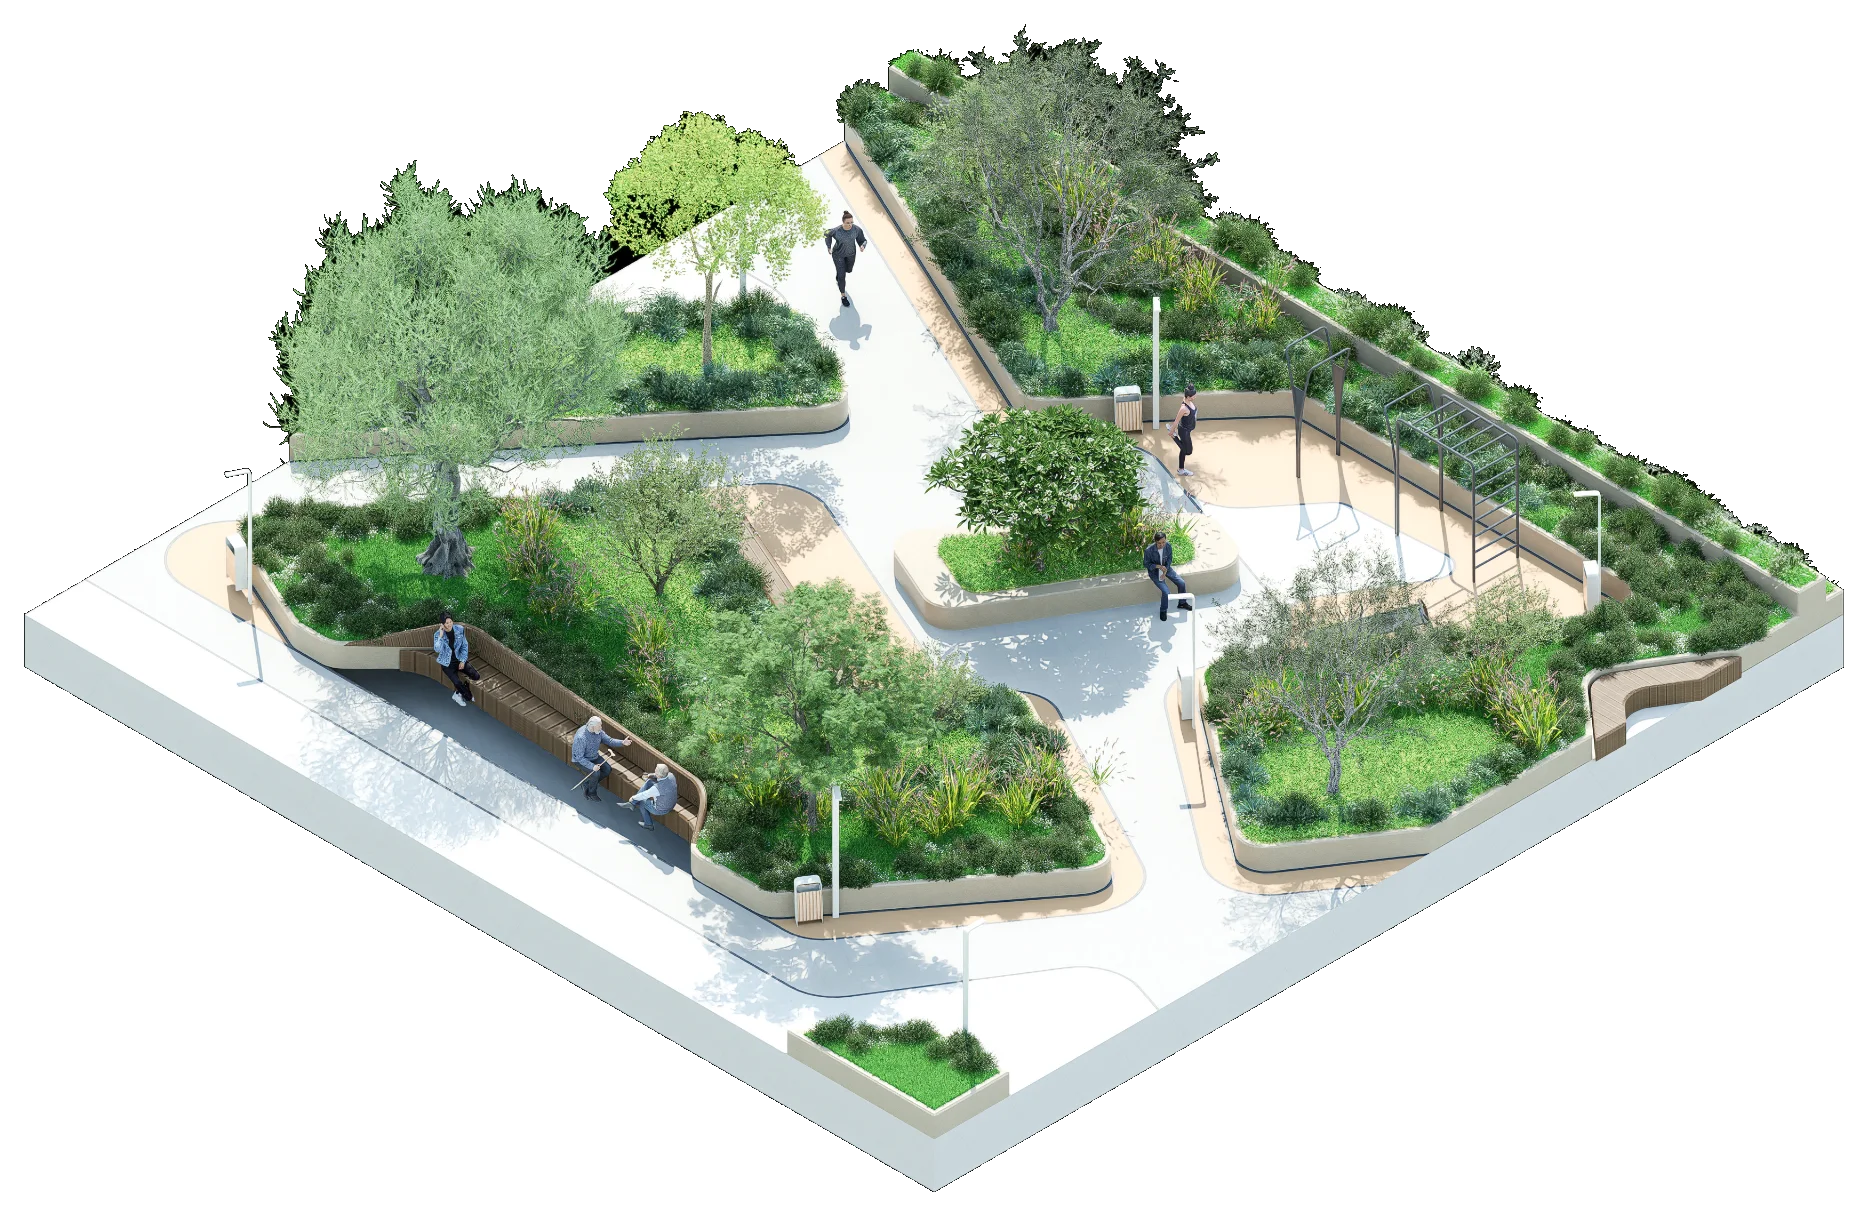
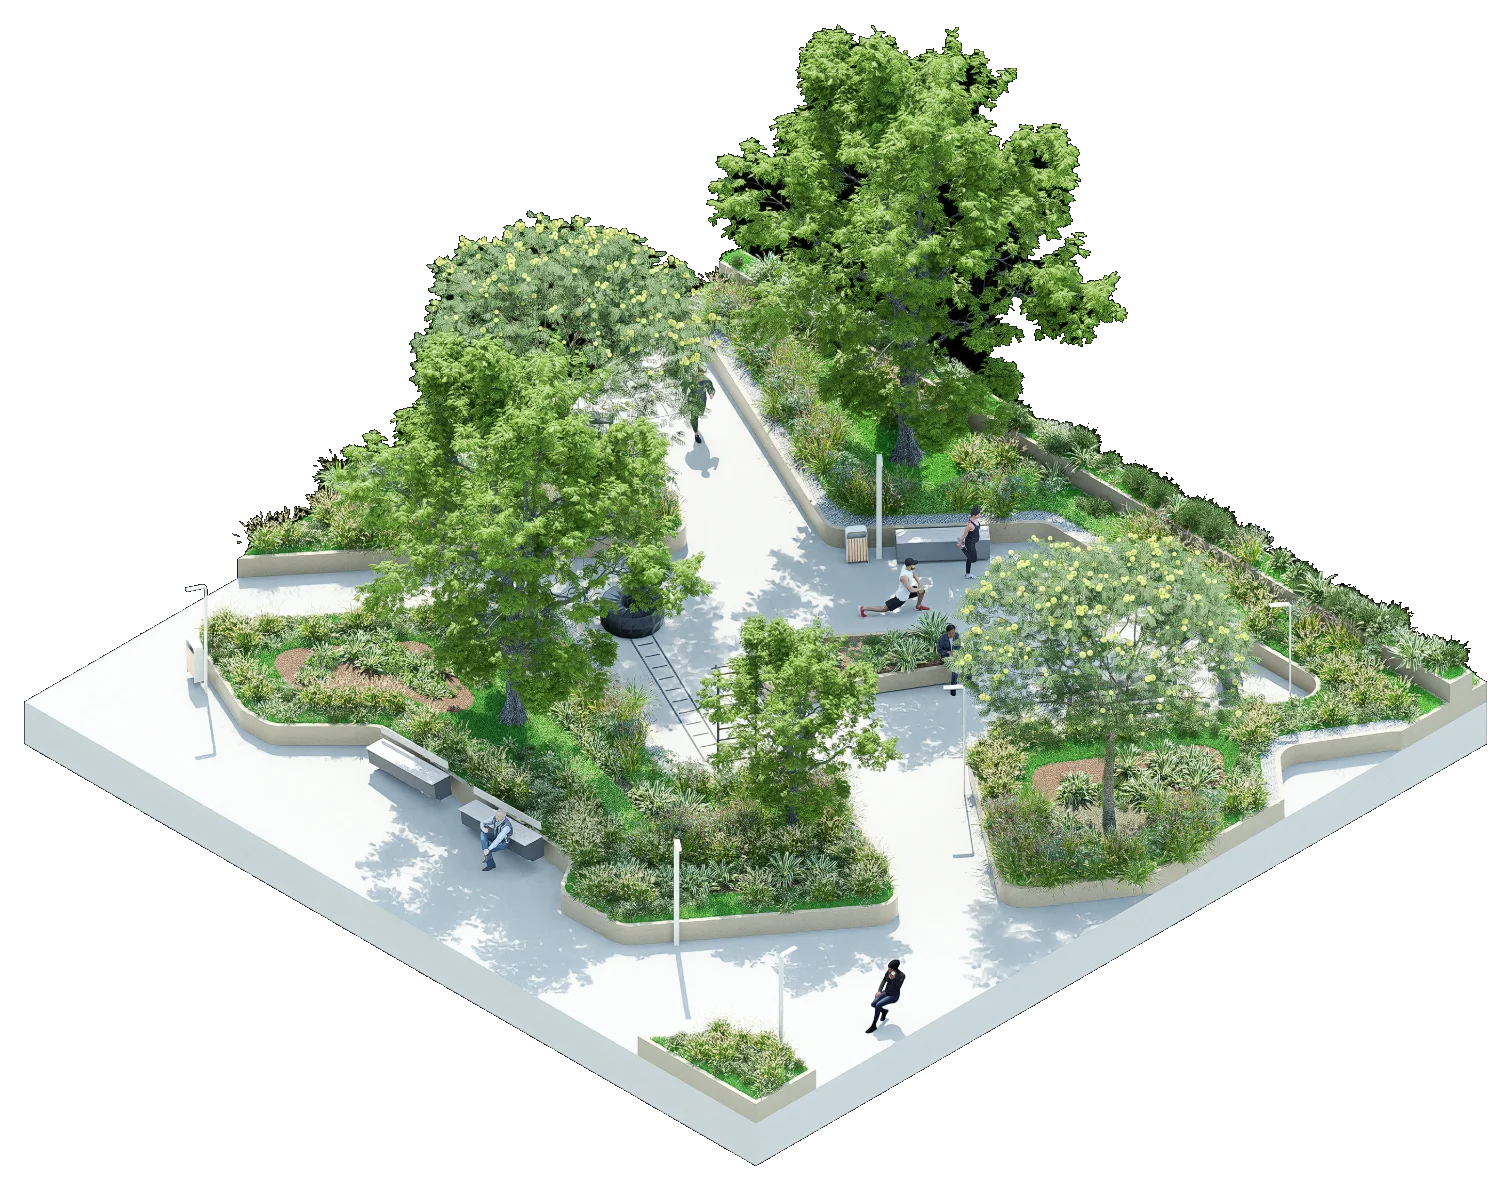
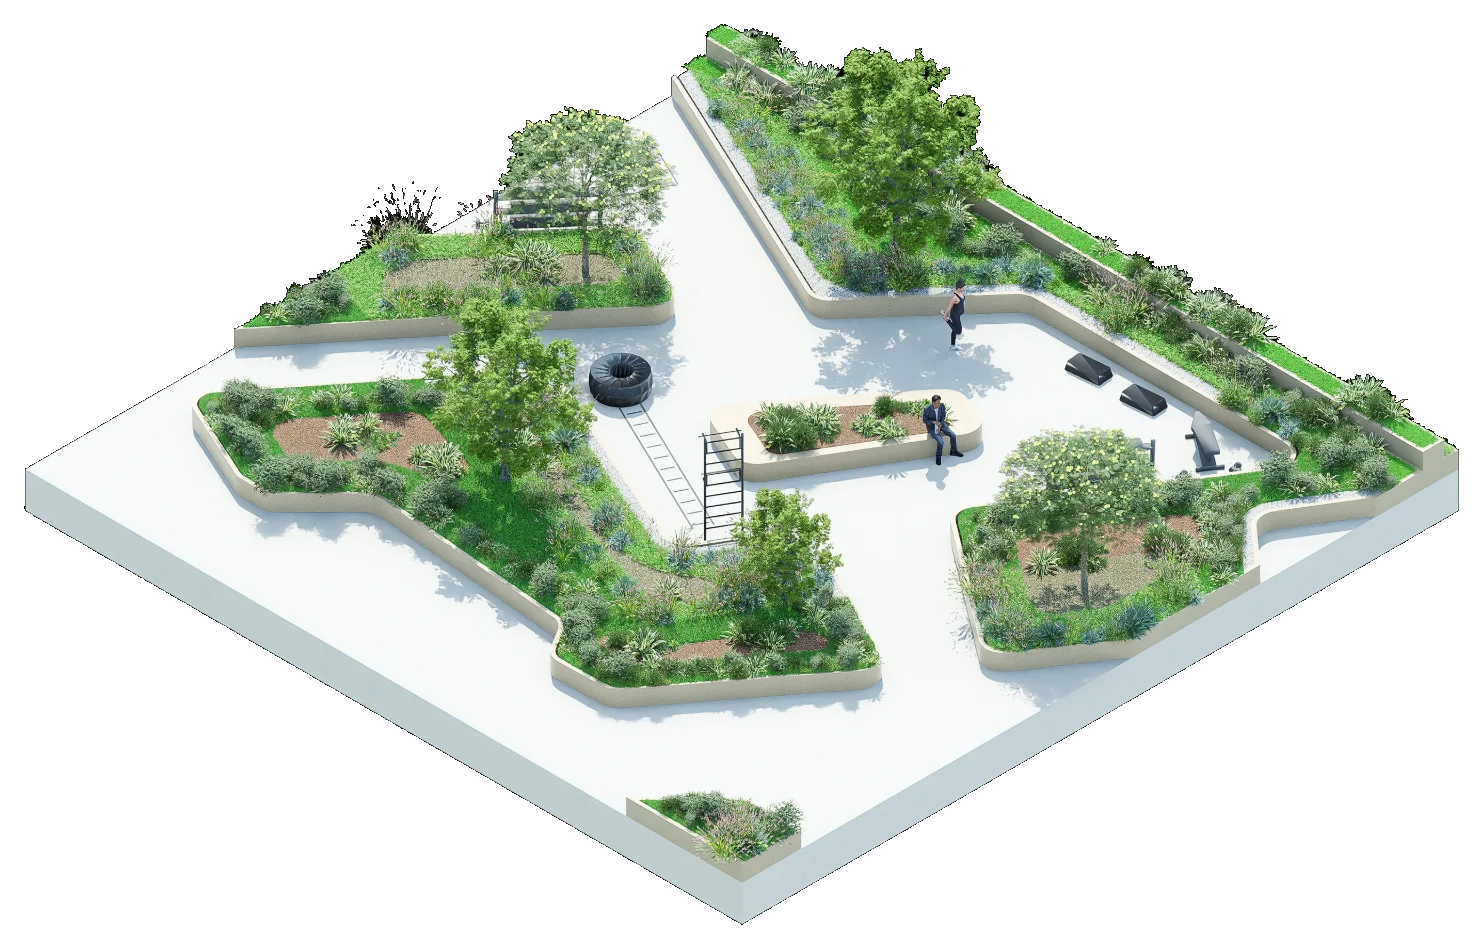
Maximum quality
Specification data (20 × 20 m)
Price per sqft
- Planting
- —
- Flooring
- —
- Furniture
- —
- Irrigation
- —
- Water demand
- —
- Hardscape type
- —
- Shrub bed
- —
- Xeriscape
- —
Tree species
7 treesThe output
What lands on your desk
Comfort maps
UTCI by season, for year 1, year 5 and year 15.
Shade forecast
Canopy and shade as the trees grow.
Dwell forecast
Where people will stop, and for how long, zone by zone.
Cost bands
Cost per square foot from live nursery and supplier pricing.
Value case
Spend, premium and retention, written for the board.
Bloom calendar
A month by month planting forecast, month 1 to 36.
Where it applies
One engine. Three scales
Same engine, different invoice.
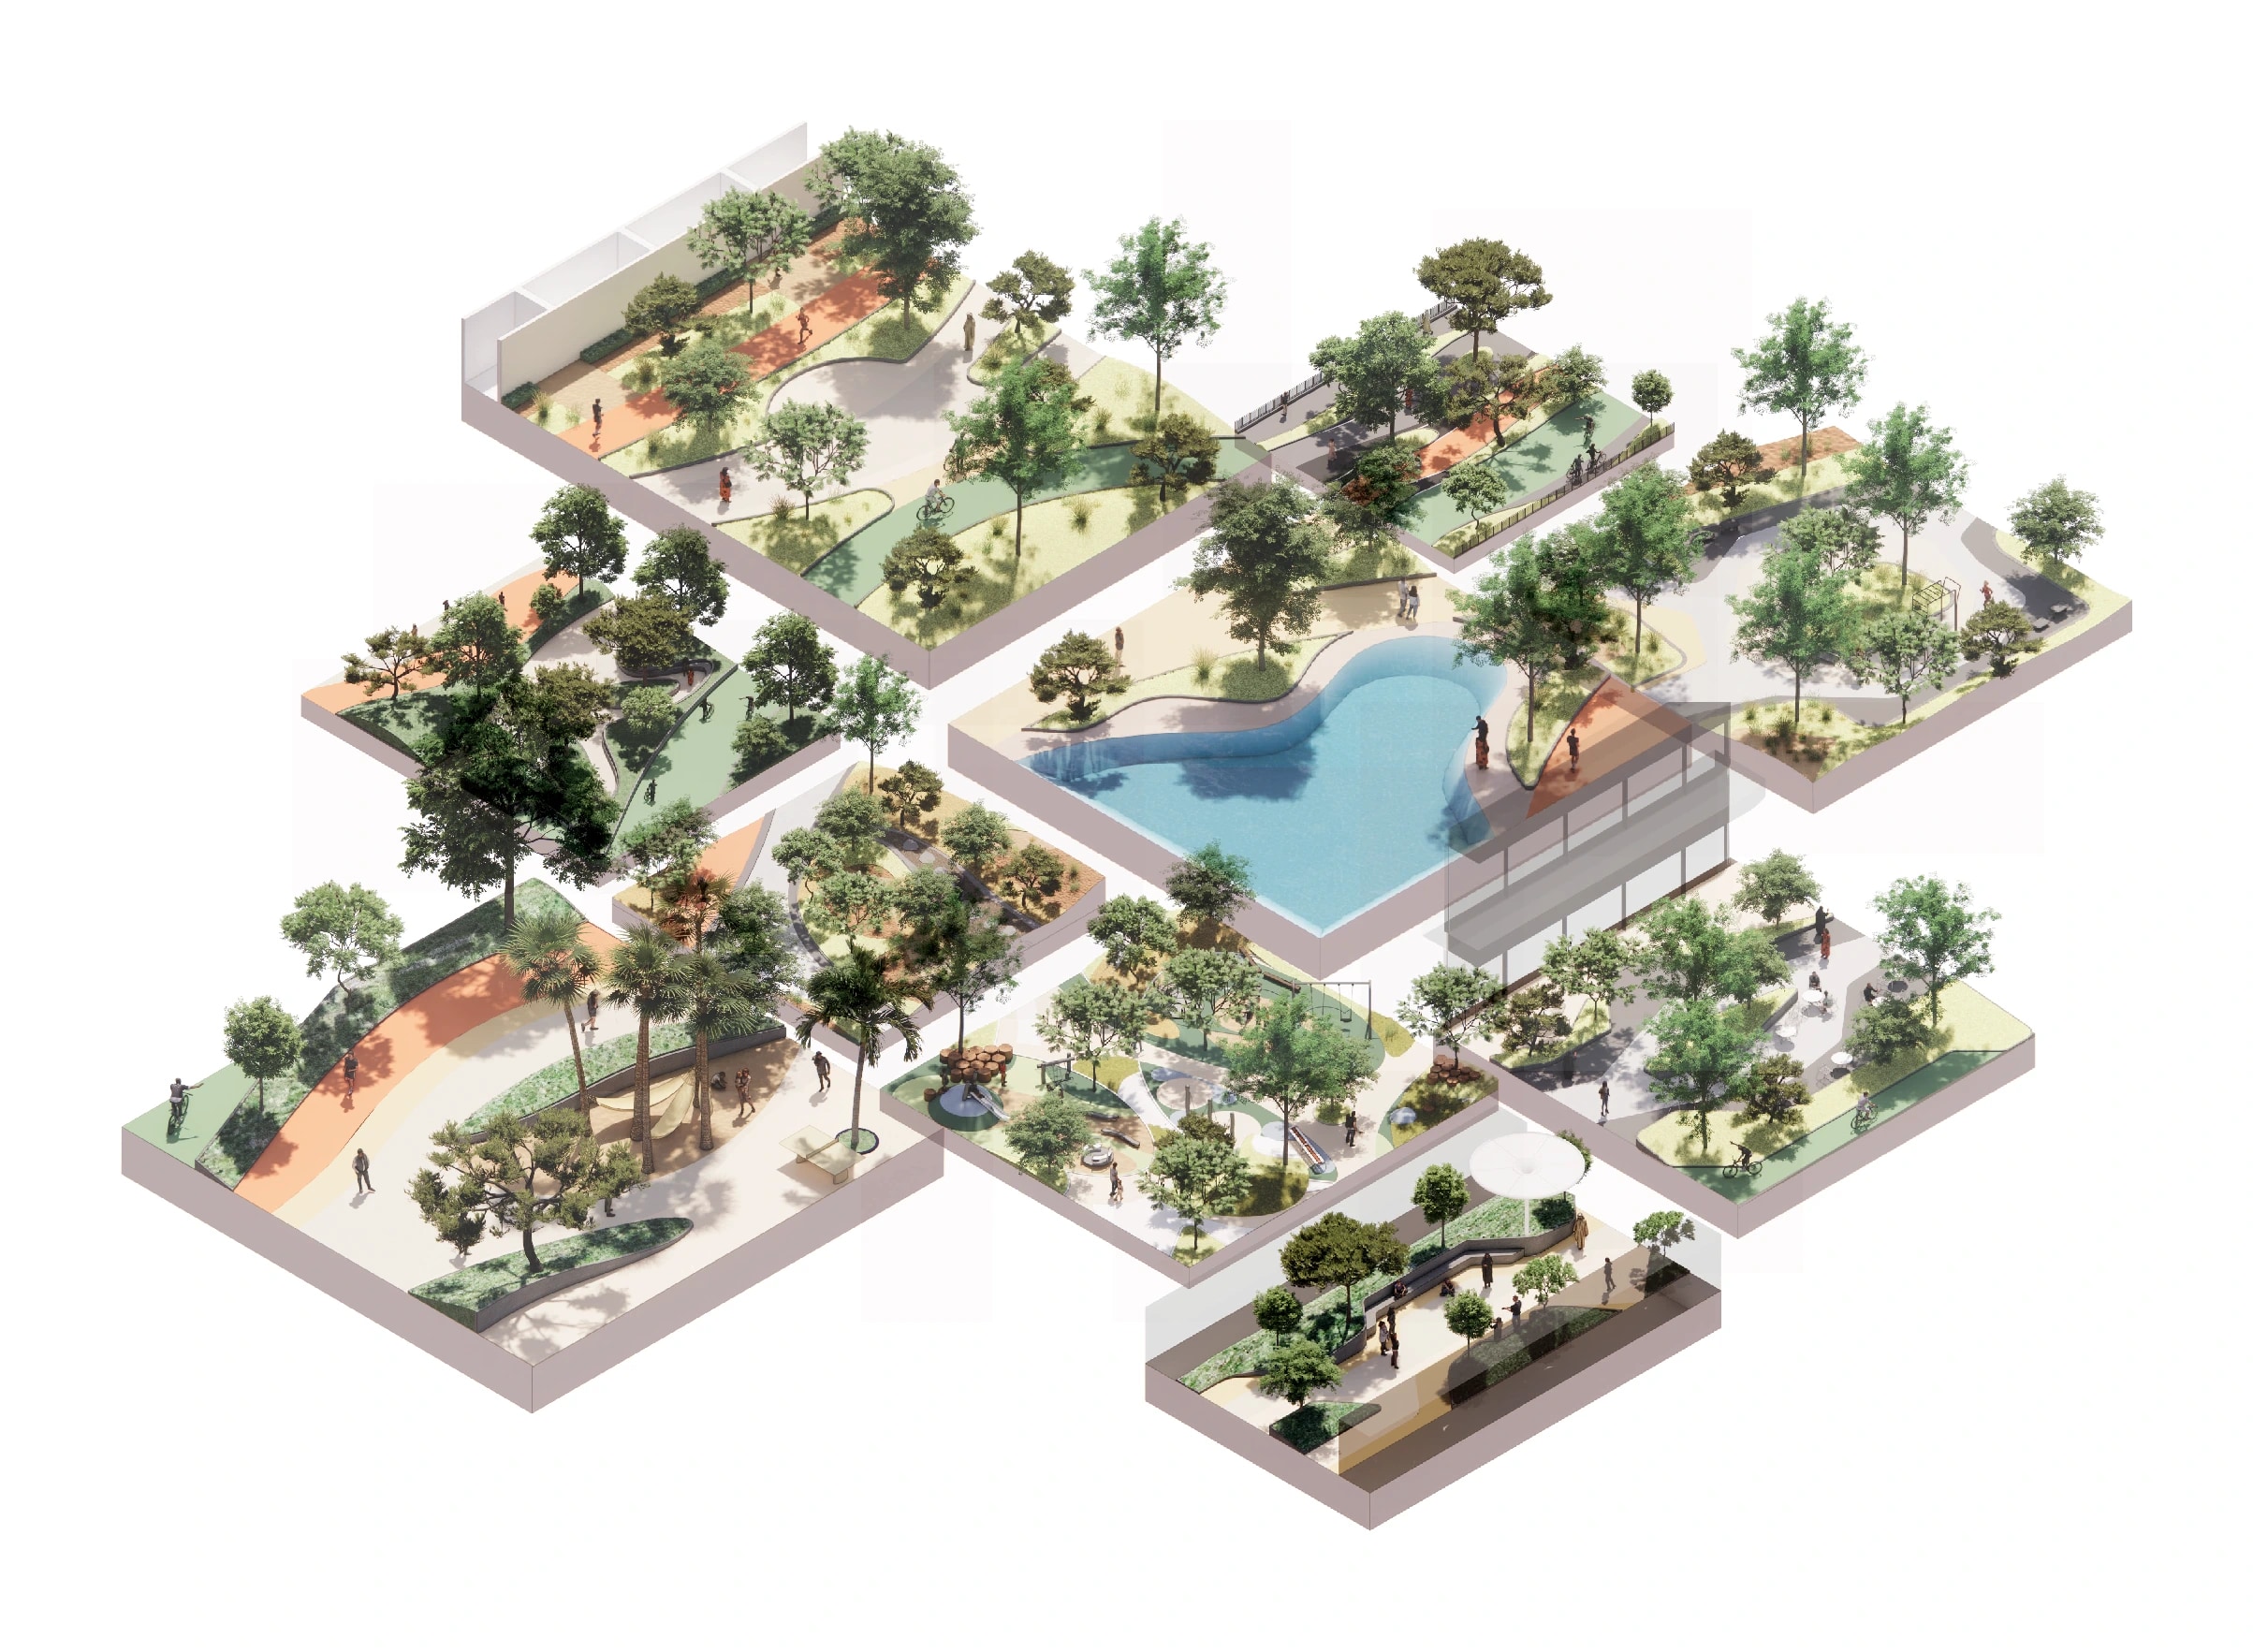
Masterplan
Finance grade evidence. Growth modelled and monitored over 30 years supports sustainable finance, natural capital reporting and Biodiversity Net Gain.
Residential
Premium and retention. Podiums and courtyards where comfort and planting justify the price and keep residents for longer.
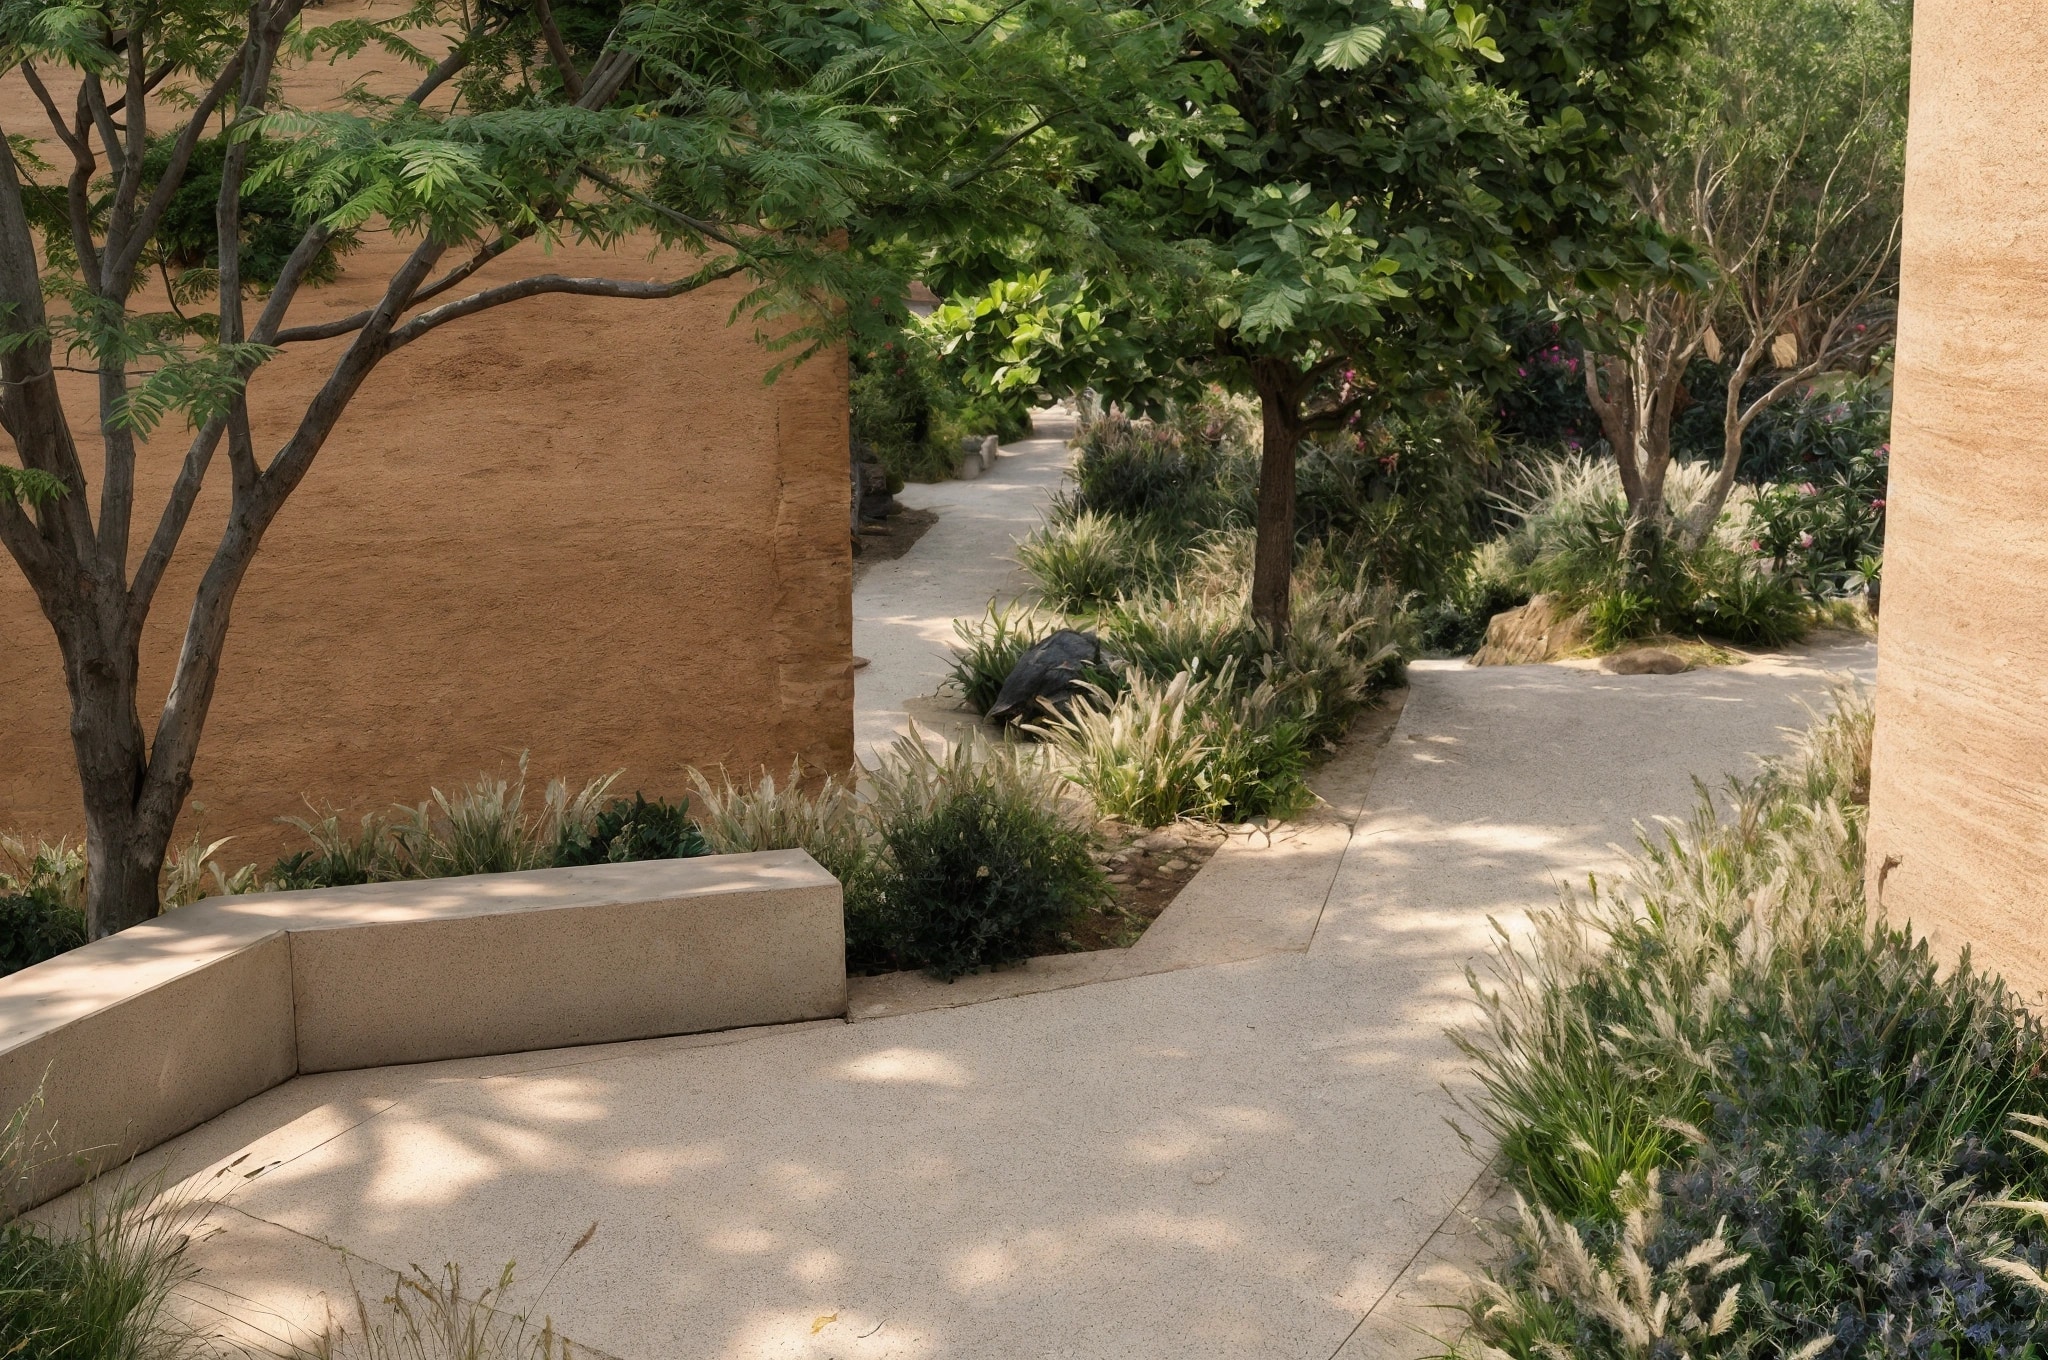
Retail and hospitality
Dwell becomes spend. Terraces and streets where every extra minute is another coffee.
Why it cannot be copied
A weekend can copy the screen. Not the evidence
Data loop
Every project adds measured behaviour. A copycat starts at zero.
Validated
Tested on real sites, not on assumptions.
Right to measure
Measurement after occupancy is written into our contracts.
Judgment
Analysis delivered by people who built the places.
Every project makes the next one sharper
Next step
Let’s put it on a real site
We are looking for a London pilot: a developer, architect or investor with a plot and a question.
Start a conversationSpecify with intention
A landscape does not need to become a different design to become more economical. The specification can evolve while the spatial idea remains intact.